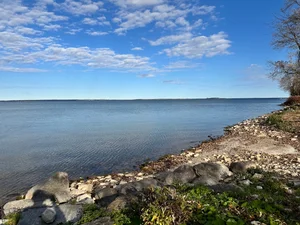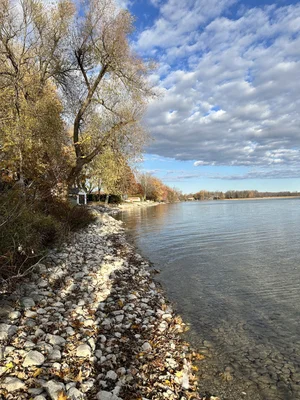
If you own on Lake Simcoe, or you’re thinking about it, the shoreline you see in November isn’t the shoreline you saw in May. Seasonal change is expected. What it looks like on any one shoreline also depends on wind, waves and the property itself.
Who manages the lake. Lake Simcoe isn’t “controlled” the way a bathtub is. The Lake Simcoe Region Conservation Authority describes it as managed, and the manager is Parks Canada, through the Trent-Severn Waterway, because Lake Simcoe is one piece of a much larger chain of lakes and rivers. A change made at one end of that chain has to work for the whole system.
What guides the water level? Lakes Simcoe and Couchiching are managed under a rule curve, which Parks Canada describes as a target or guide for water levels throughout the year. It has been in effect since 1918, and Parks Canada notes that lakes this large react slowly to weather and to changes at the dams. (Source: Parks Canada, Trent-Severn Waterway, “What is water management?”)
Why the water goes down every year. As summer goes on, levels drop because of increased evaporation and reduced inflows. The managed lowering that happens every year at the same time is called drawdown. It begins in summer, to make room for the precipitation that comes in fall, winter and spring, and the lowest levels come in late fall and winter. (Source: LSRCA, “Lake Simcoe Water Levels.”) So a lower waterline in November is part of the yearly pattern. What it means for a particular shoreline is a separate question.
What 2026 looked like. This spring the lake ran high. April brought about 150 mm of rain, compared with the usual 75 mm. The snowpack also melted within two weeks. The lake peaked at 219.42 m at Beaverton on April 26, which is high, but still below the 1960 historic high of 219.48 m. By June 26 the lake was down to about 9 cm above average. (Source: LSRCA Board presentation, July 10, 2026.)
Where the lake stood on October 30. Parks Canada’s Lake Simcoe gauge read 218.749 m on October 30. The average for that date is 218.73 m. After a spring that ran high, the lake was near its seasonal average, about 2 cm above average. (Source: Parks Canada water levels, Lake Simcoe level gauge, Oct 30, 2026.)
Same shore, six months apart.
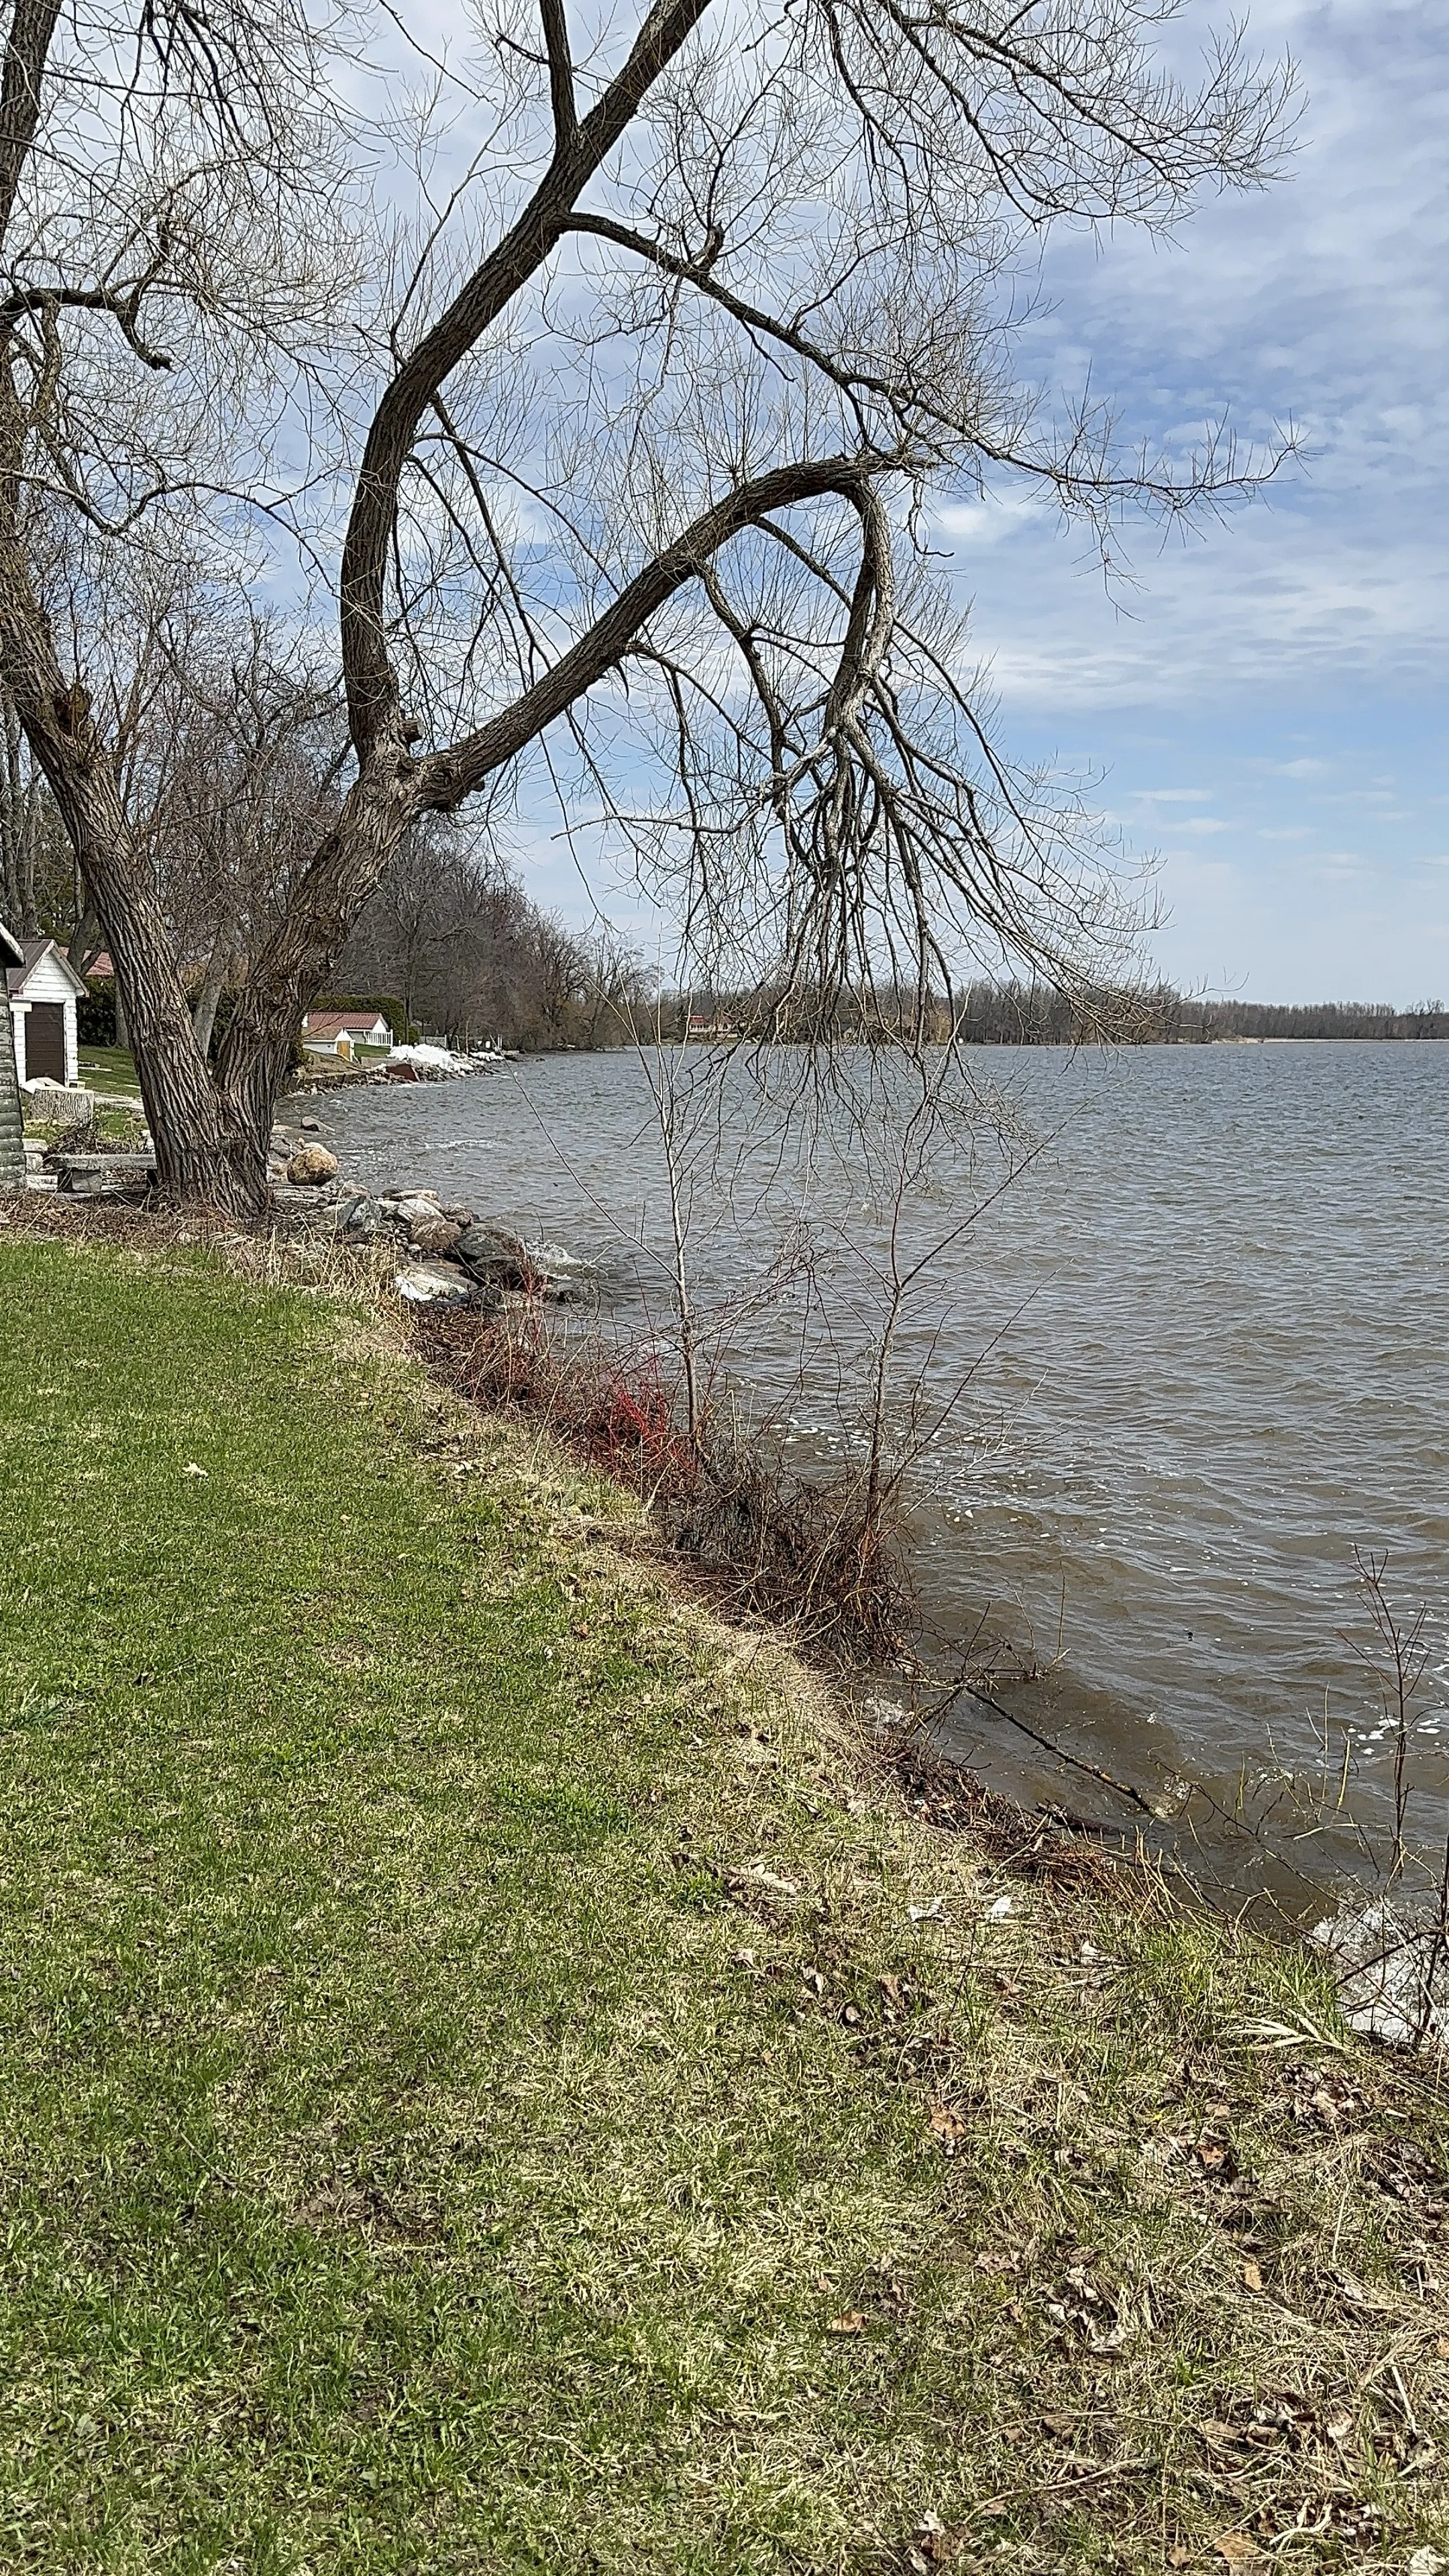
April 21, 2026, as the lake ran high. Bonnie Beach, Ramara.
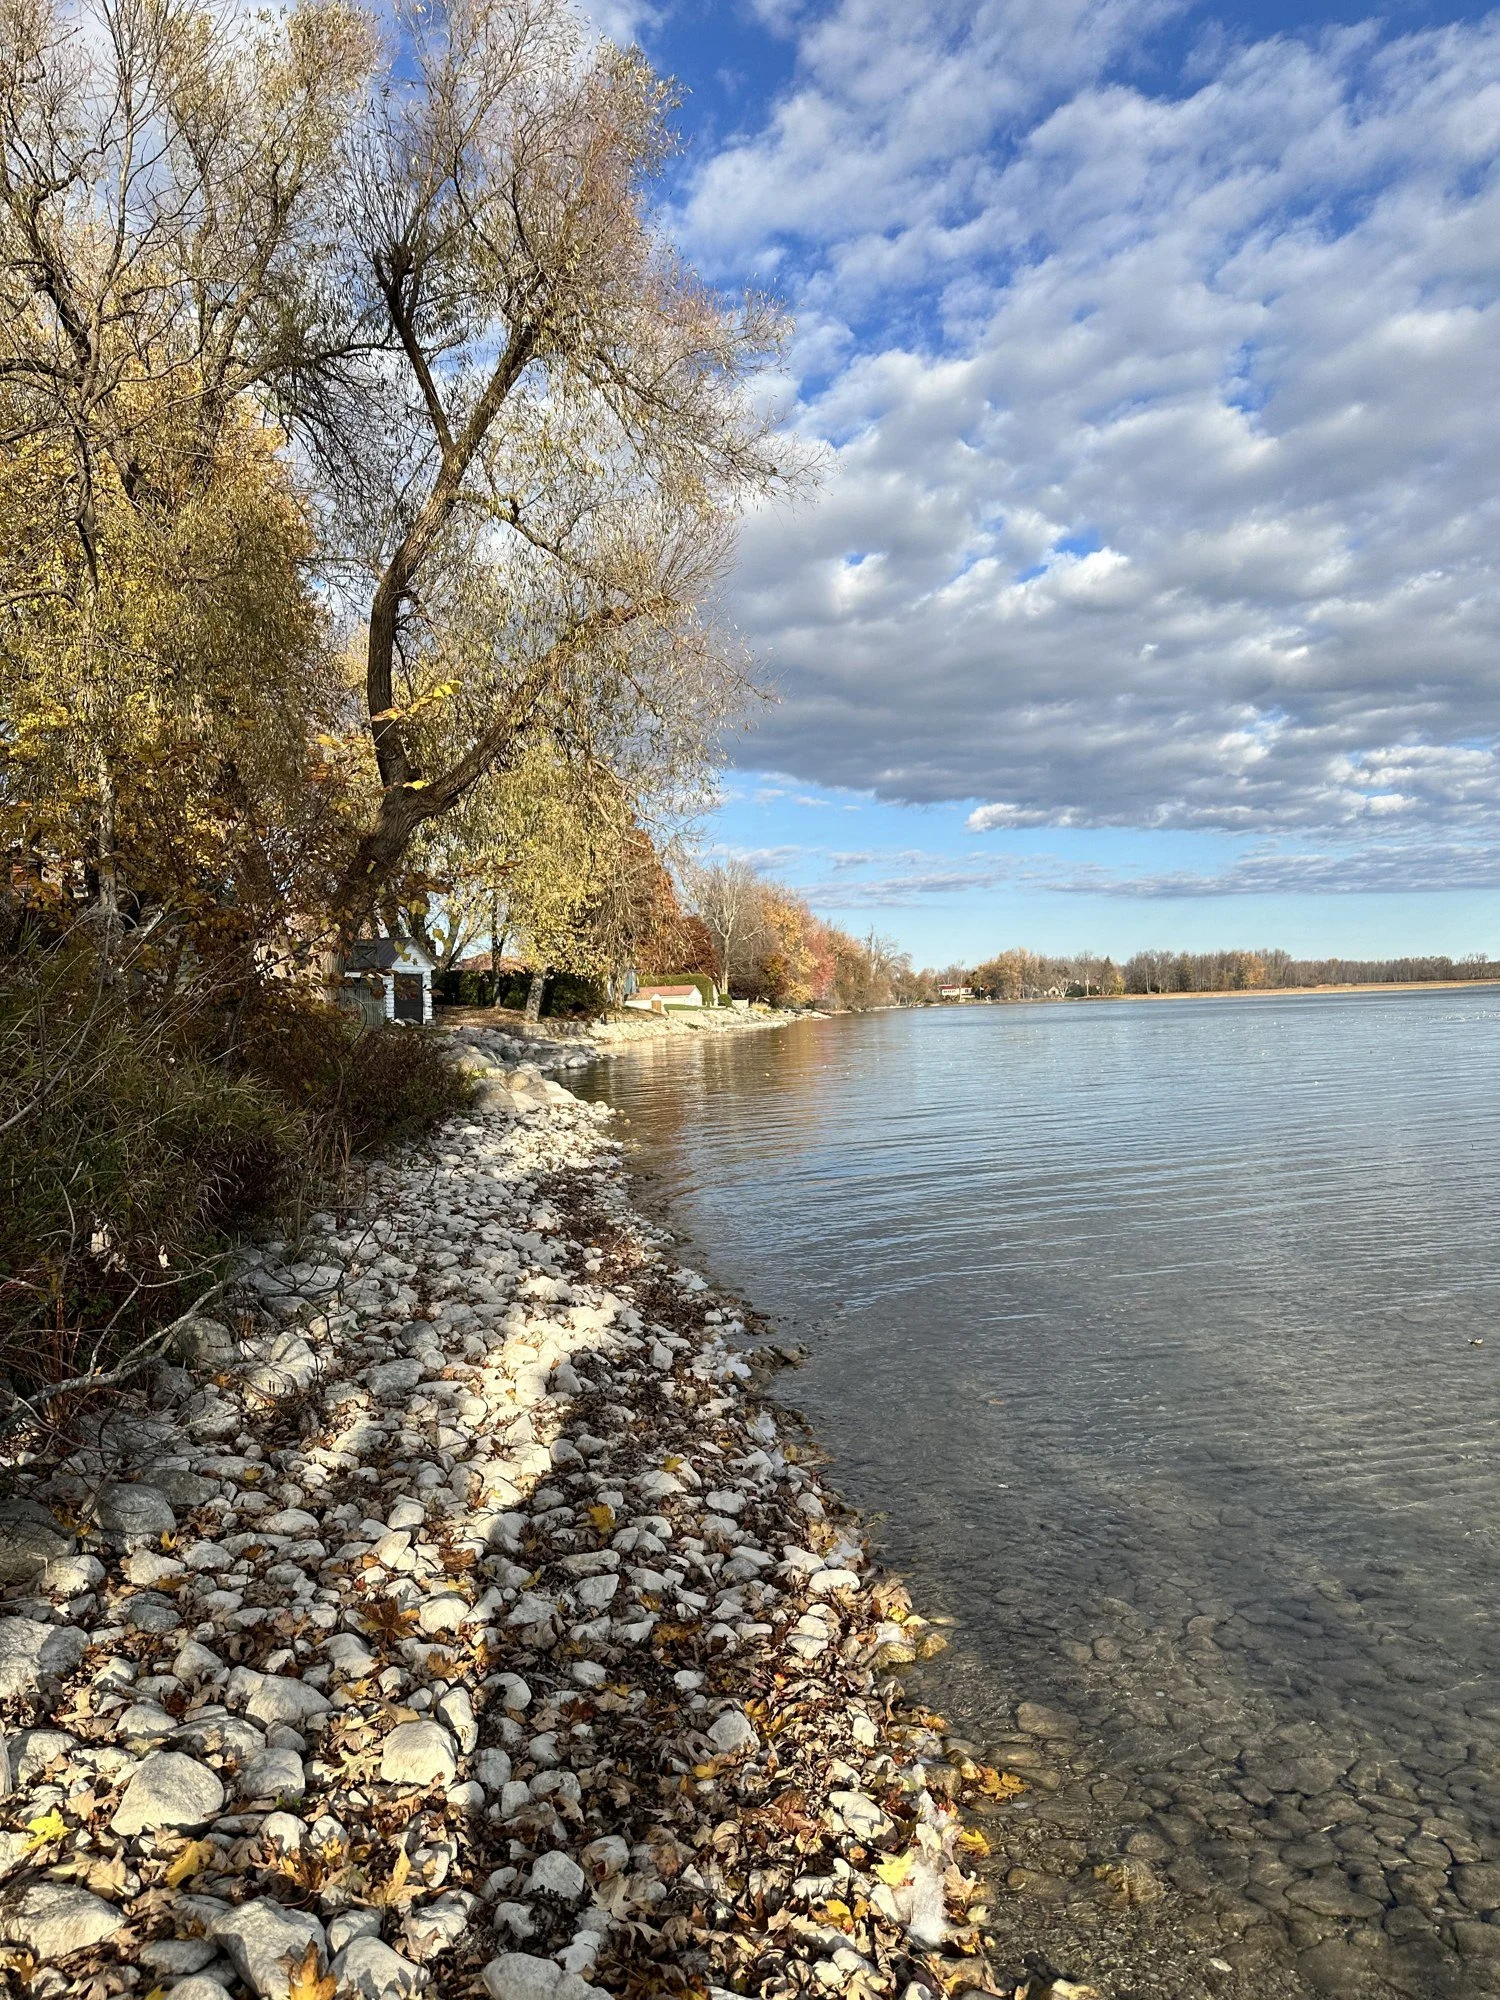
October 31, 2026. Lake Simcoe near its seasonal average (Parks Canada gauge, October 30: 218.749 m against an average of 218.73 m). Bonnie Beach, Ramara.
Same stretch of shore, with the leaning willow at left. In April the water was at the edge of the grass. In October a strip of stones shows between the bank and the water.
One caution: wind and waves change the waterline in any photograph, and the April surface was choppy. The photos show the shore. The gauge measures the lake.
Bill’s Insider Take: The docks are out for the season, and there’s more shore showing at Bonnie Beach now than there was in April. Rocks and landmarks I’m used to seeing in the water are sitting above the waterline.
What this means if you’re buying or selling on the water.
Look at a shoreline in more than one season. A property seen in July tells you something different from the same property in November.
Ask how the shoreline, dock and shore structures have handled both a high spring and lower seasonal water levels.
Before planning shoreline work, check with the relevant conservation authority about permits and any other approvals required.
If you’d like to see how a particular stretch of shoreline sits through the seasons, ask me and I’ll show you. I’d rather you see it than take my word for it.